
What Actually Drives BigQuery Costs? A Leader's Guide
Kristóf Horváth
12 min read

In this post, we map the six factors that actually move your BigQuery bill up or down, so you can tell which one is responsible before you try to reduce BigQuery costs by tuning the wrong lever. It’s written for engineering and data leaders who need the diagnostic picture, not the SQL: no query rewrites, no INFORMATION_SCHEMA walkthroughs, no reservation config steps here (those live in the posts linked along the way).
Let us paint a picture that’s painfully familiar to a lot of teams using BigQuery: a director opens this quarter’s Google Cloud invoice and notices BigQuery spend is up 40% against last quarter. Nobody added a major new workload. Nobody remembers touching a reservation setting. The instinct is usually to look at query volume first, and that’s often the wrong place to start: BigQuery spend also moves for reasons that have nothing to do with how many queries ran.
Learn all about BigQuery Editions and Reservations. Download our white paper:

What factors affect BigQuery pricing and cost?
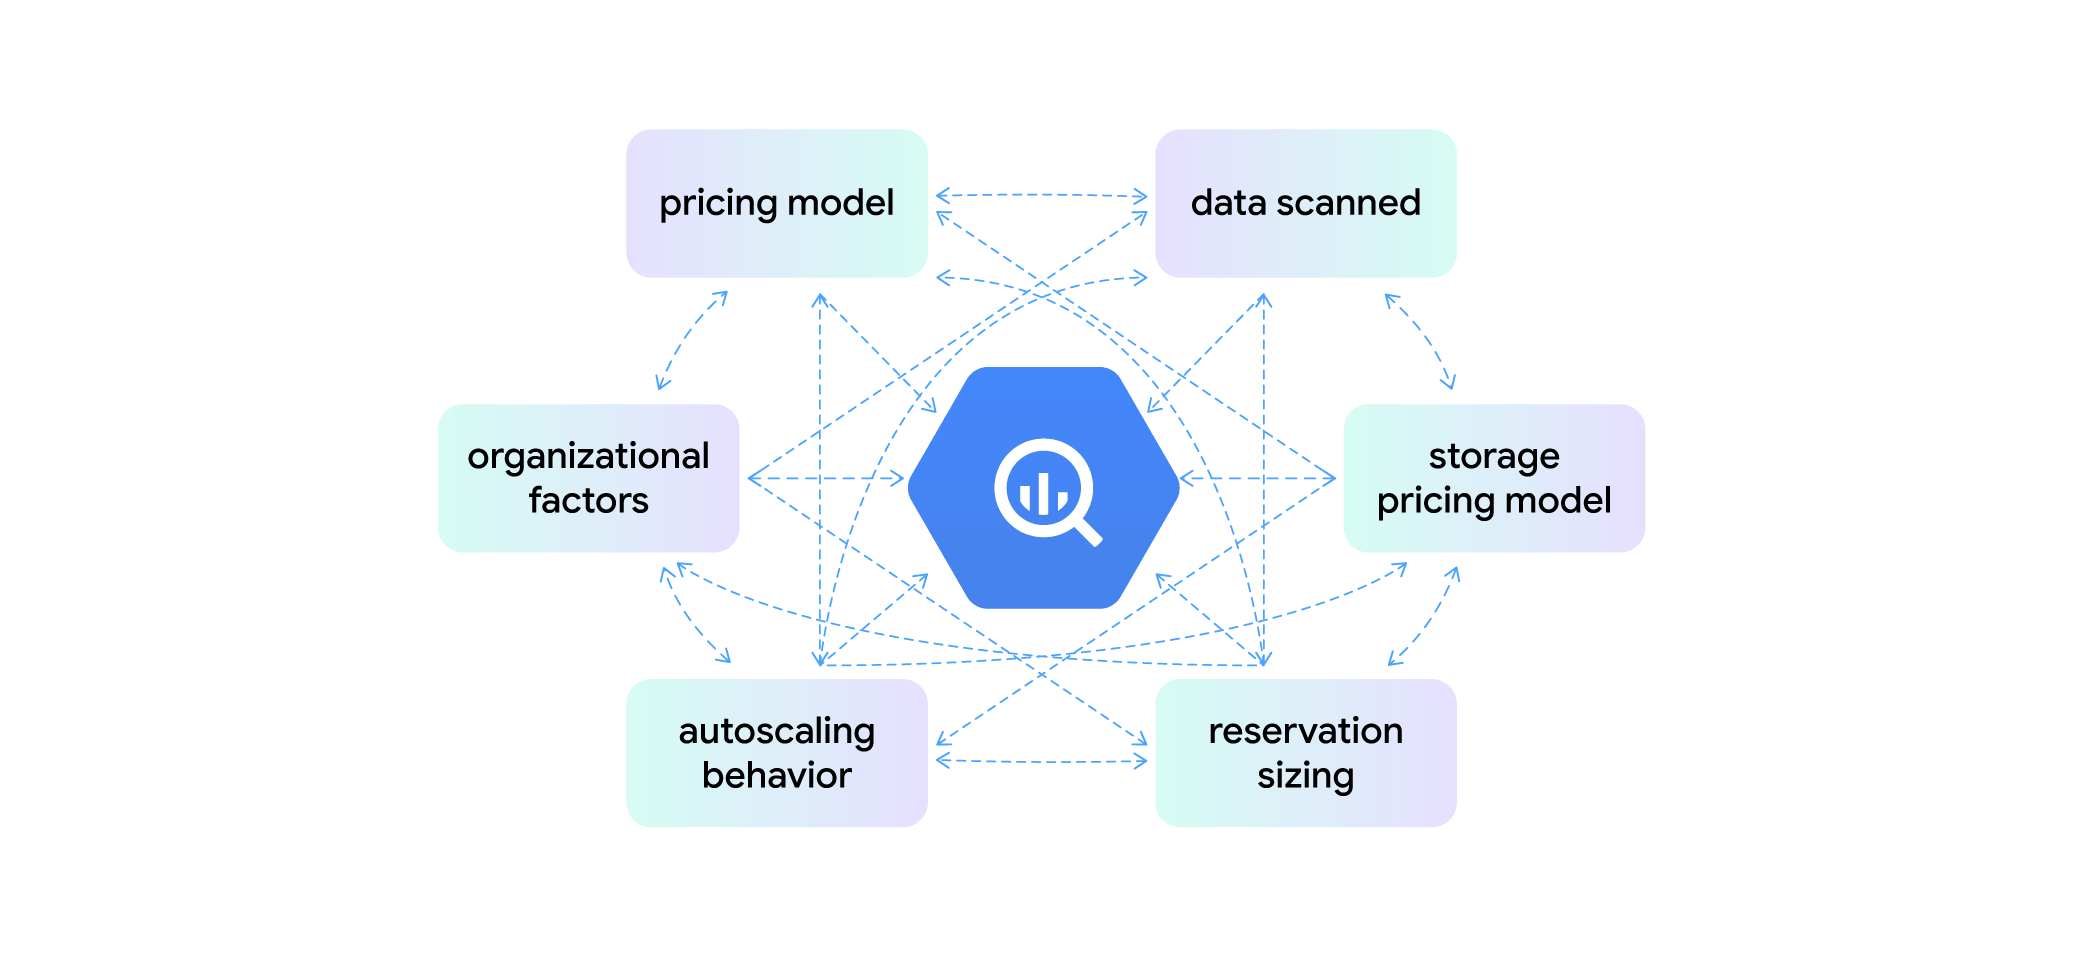
BigQuery cost isn’t a single knob you turn. It’s the output of six factors that interact: fixing one without checking the others can just move the waste somewhere else instead of removing it. The six main drivers of BigQuery costs:
- Pricing model mismatch: on-demand vs. capacity-based
- Data scanned: how much your queries actually read
- Storage pricing model: how your datasets are billed at rest
- Reservation sizing: baseline slots and commitments
- Autoscaling behavior: how burst capacity is billed
- Organizational factors: ownership, visibility, and process
None of these live in isolation. A team that switches pricing models without addressing reservation sizing can end up worse off than before. A team that fixes query patterns but never revisits storage billing leaves savings on the table. The rest of this post walks through each driver.
Driver 1: Are you on the wrong pricing model for your workload?
BigQuery gives you two fundamentally different ways to pay for compute, and picking the wrong one for your workload shape is one of the most common reasons costs run higher than expected.
On-demand pricing charges per byte scanned: $6.25 per tebibyte (TiB) in US regions (check pricing for your region on cloud.google.com). Capacity-based pricing (reservations) charges by slot-hour consumed, at $0.06 per slot-hour on Enterprise edition in US regions (check pricing for your region on cloud.google.com), regardless of how much data a query reads.
These measure two completely different things, which is why the same workload can cost very differently depending on the model. Teams that stay on on-demand as query volume grows into daily, high-volume pipelines pay the full byte rate on every run. Teams that move everything to reservations too early pay for slot capacity that sits idle outside a handful of busy hours. Neither mistake shows up as one obvious line item. It shows up as a bill that’s higher than it should be, with no single cause anyone can point to.
Learn more:
BigQuery Pricing Models Explained: On-Demand vs Capacity-Based
Driver 2: How much data are your queries actually scanning?
Independent of which pricing model you’re on, the amount of data your queries touch is a direct cost driver. Under on-demand, more bytes scanned means a higher bill per query. Under capacity-based pricing, queries that scan large volumes of data still tend to consume more slot-seconds, even though the relationship isn’t one-to-one.
The most common version of this isn’t a single expensive query, it’s a repeated pattern: scheduled jobs that reprocess an entire table on every run instead of only the data that actually changed. A table that’s small in month one keeps costing more every month as it grows, even though the query logic never changes. Full-table scans on unfiltered queries, and tables that were never structured around the columns queries actually filter on, are two more versions of the same underlying issue: BigQuery has no way to skip data it hasn’t been told to skip.
This is a pattern to recognize, not a query to write. If a scheduled job’s runtime and cost keep climbing in step with total table size rather than with how much new data actually arrived, that’s the signal. Teams that rewrite that pattern into incremental processing instead of full reloads routinely cut the affected queries’ scan volume by 90%+.
Learn more:
BigQuery Partitioning: How It Works, When to Use It, and What It Costs
Driver 3: Are you overpaying for BigQuery storage without realizing it?
Compute (the two drivers above) and storage are billed completely separately in BigQuery, and BigQuery storage costs have their own set of decisions that move independently of any query.
Storage price drops automatically once a table or partition hasn’t been modified for a period of time, to roughly half the price of actively-modified data (check current storage pricing for your region). Tables that get fully rewritten on every scheduled run never age into that cheaper tier, because the rewrite resets the clock on every partition. That’s a second, easy-to-miss cost of the full-reload pattern from Driver 2.
Separately, BigQuery lets you bill storage by logical (uncompressed) size or by physical (compressed) size. Which one is cheaper depends on how well a given dataset compresses and how often it changes, and the answer isn’t the same for every dataset in your project, nor is it fixed once you’ve picked it.
Learn more:
How to Choose the Right BigQuery Storage Pricing Model (Logical vs Physical) to Save up to 60%
Driver 4: Is your reservation sized for how you actually use it?
If you’re on capacity-based pricing, two settings determine most of your reservation cost: baseline slots and commitments.
Baseline slots are allocated, and billed, every second the reservation exists, whether or not a query is running. A baseline set to cover peak demand means paying for peak capacity around the clock, including nights and weekends when nothing is running. The same logic applies to commitments: committing to a slot count for a 1-year (20% discount) or 3-year (40% discount) term only pays off if that capacity reflects genuine steady-state usage, not an occasional peak.
This is where a lot of “our bill went up even though we did the pricing math” surprises come from. The pricing model decision was right; baseline and commitments were just sized against the busiest hour instead of the typical one. Getting a commitment rightsized before signing a 1- or 3-year term is the difference between a discount and a locked-in cost.
Learn more:
How to Configure BigQuery Baseline Slots and Slot Commitments
Driver 5: Is autoscaling smoothing over a sizing problem?
Autoscaling adds a layer on top of baseline: it lets a reservation borrow more slots temporarily when demand spikes, up to a max slots ceiling you set. It’s genuinely useful for bursty workloads, but it has cost behavior that’s easy to miss.
Scaling up costs money the moment it happens, and how long that extra capacity actually gets used depends on the workload. Set max slots high enough, and a reservation full of short, bursty queries can end up paying for scaled-up capacity that a given query barely touches before finishing, even though the autoscaler is technically working exactly as designed. Some teams address this by routing specific queries back to on-demand instead of raising a committed reservation’s ceiling.
A related, easy-to-miss factor: if you run multiple reservations, unused baseline capacity from one can flow to others as idle slots. Google changed the default rule for how that idle capacity gets distributed in April 2026, and depending on how your reservations are set up, that change can shift a meaningful amount of capacity between workloads without anyone touching a config.
Learn more:
BigQuery Reservations: How Does Autoscaling Really Work?
Driver 6: Why do BigQuery costs increase over time even when workloads stay flat?
The first five drivers are technical. The sixth is organizational, and it’s the one leadership tends to miss, because it doesn’t show up as a line item. It shows up as the same technical problems recurring every few months after they’ve supposedly been fixed.
The pattern: nobody owns BigQuery cost at the team or project level, so nobody notices drift until the bill arrives. There’s no alerting on cost anomalies, so a misconfigured job or a newly expensive query pattern runs for weeks before anyone reacts. Datasets and reservations accumulate without a review process, and access to ship new production workloads isn’t paired with any expectation that the requester understands what it will cost.
This is the driver that explains why teams that clean up their pricing model, query patterns, storage, and reservation sizing once still see costs creep back up a couple of quarters later: the decisions that caused the original waste are still being made the same way. In this case study, a low-cost airline running lean data teams across the APAC region hit this directly: engineering velocity was high, but nobody could see the cost impact of a new query before it shipped to production, so bills kept arriving as surprises weeks after the spend had already happened:
Learn more:
Case Study: From Surprise BigQuery Bills to Pre-release Cost Control
Dashboards alone don’t fix this driver either: they show what already happened, not who should act on it. Building the ownership and rituals that close the gap is its own topic, covered in how to build a cloud cost culture inside your engineering team and in why cost dashboards fail to prevent the next spike.
Which driver should you fix first to reduce BigQuery costs?
You don’t need to audit all six drivers every time the bill moves. If you don’t know where to start, three questions narrow it down fast:
Is the increase gradual or a step change? A steady climb over months points toward data growth (Driver 2), storage aging (Driver 3), or organizational drift (Driver 6). A sudden jump in a single billing period points toward a specific change: a new pipeline, a reservation config change, or a workload that moved between pricing models.
Is it bill-wide or tied to a specific project or team? If one project or reservation is driving the change, start with that team’s pricing model fit (Driver 1) and reservation sizing (Driver 4). If it’s spread across the org, look at storage (Driver 3) and organizational ownership (Driver 6) first, since those tend to accumulate broadly rather than in one place.
Did it follow a known change? A recent migration, a new scheduled pipeline, a headcount increase on a data team, or an edition change are all direct lines to a specific driver. If nothing obvious changed, that’s informative too: it usually points to Driver 2 or Driver 6 rather than a single deliberate decision.
The answers to these three questions usually narrow things down to one or two drivers worth investigating, not a full audit of your entire BigQuery setup.
| Question | What you see | Likely driver(s) |
|---|---|---|
| Gradual or step change? | Steady climb over months | Data scanned (2), storage aging (3), organizational drift (6) |
| Sudden jump in one billing period | Pricing model (1), reservation config (4), or autoscaling (5) | |
| Bill-wide or team-specific? | Tied to one project or reservation | Pricing model fit (1), reservation sizing (4) |
| Spread across the org | Storage (3), organizational ownership (6) | |
| Followed a known change? | Yes: migration, new pipeline, headcount, edition change | Direct line to that specific driver |
| No obvious change | Usually data scanned (2) or organizational (6) |
How Rabbit maps these drivers automatically
Everything above is diagnostic work, and it’s the part of BigQuery cost optimization most teams skip: figuring out which of six independent, interacting factors is actually responsible for a change in spend, rather than guessing. Doing that by hand means pulling billing data, usage stats, and reservation configs into one place, and repeating the exercise every time the bill moves, because the drivers keep interacting as usage evolves.
Rabbit tracks and optimizes all of this continuously across projects, labels, and accounts: per-job cost, on-demand vs. capacity-based fit, and slot usage patterns, paired with anomaly detection that flags spikes and gradual drift (Driver 6’s blind spot) against a 90-day usage baseline, rather than waiting for a monthly bill to reveal it. On the reservation side, the Reservation Planner recommends baseline and max slot settings from actual usage history (Driver 4), with projected savings typically in the 20–50% range, and the Max Slot Optimizer caps autoscaler ceilings to reduce the waste pattern described in Driver 5 by up to 40%. Storage billing model recommendations cover Driver 3 on a per-dataset basis.
None of this replaces understanding the six drivers. It replaces re-running the diagnostic by hand every time the bill changes. Use the BigQuery Savings Calculator to see a rough estimate of what Rabbit would save in your environment.
Whichever driver you landed on, here’s where to go deeper:
- Driver 1 (pricing model): BigQuery Pricing Models Explained: On-Demand vs Capacity-Based
- Driver 2 (data scanned): BigQuery Partitioning: How It Works, When to Use It, and What It Costs or BigQuery Optimization: From Full Reload to Incremental Processing
- Driver 3 (storage): BigQuery Logical vs Physical storage pricing
- Driver 4 (reservation sizing): How to Configure BigQuery Baseline Slots and Slot Commitments
- Driver 5 (autoscaling): BigQuery Reservations: How Does Autoscaling Really Work?
- Driver 6 (organizational): How To Build a Cloud Cost Culture Inside Your Engineering Team