The True Cost of Manual BigQuery Optimization: A FinOps Perspective
Kristóf Horváth
12 min read
This post is for CFOs, VPs of Engineering, and FinOps leads who need a business case for BigQuery cost optimization beyond the GCP line item. We cover the hidden total cost of manual Google Cloud optimization: engineering hours, delayed product work, coordination overhead, and the risk that savings do not stick. The goal is not a tuning guide. It is a FinOps lens on what manual programs actually cost, and when continuous automation earns its place.
Most teams already know their BigQuery bill. Fewer track what they spend in engineering time, backlog capacity, and organizational friction to keep that bill from growing. When finance asks for a 15% reduction, the conversation usually stops at the invoice. The real question is whether manual BigQuery optimization is still the cheapest way to get there.
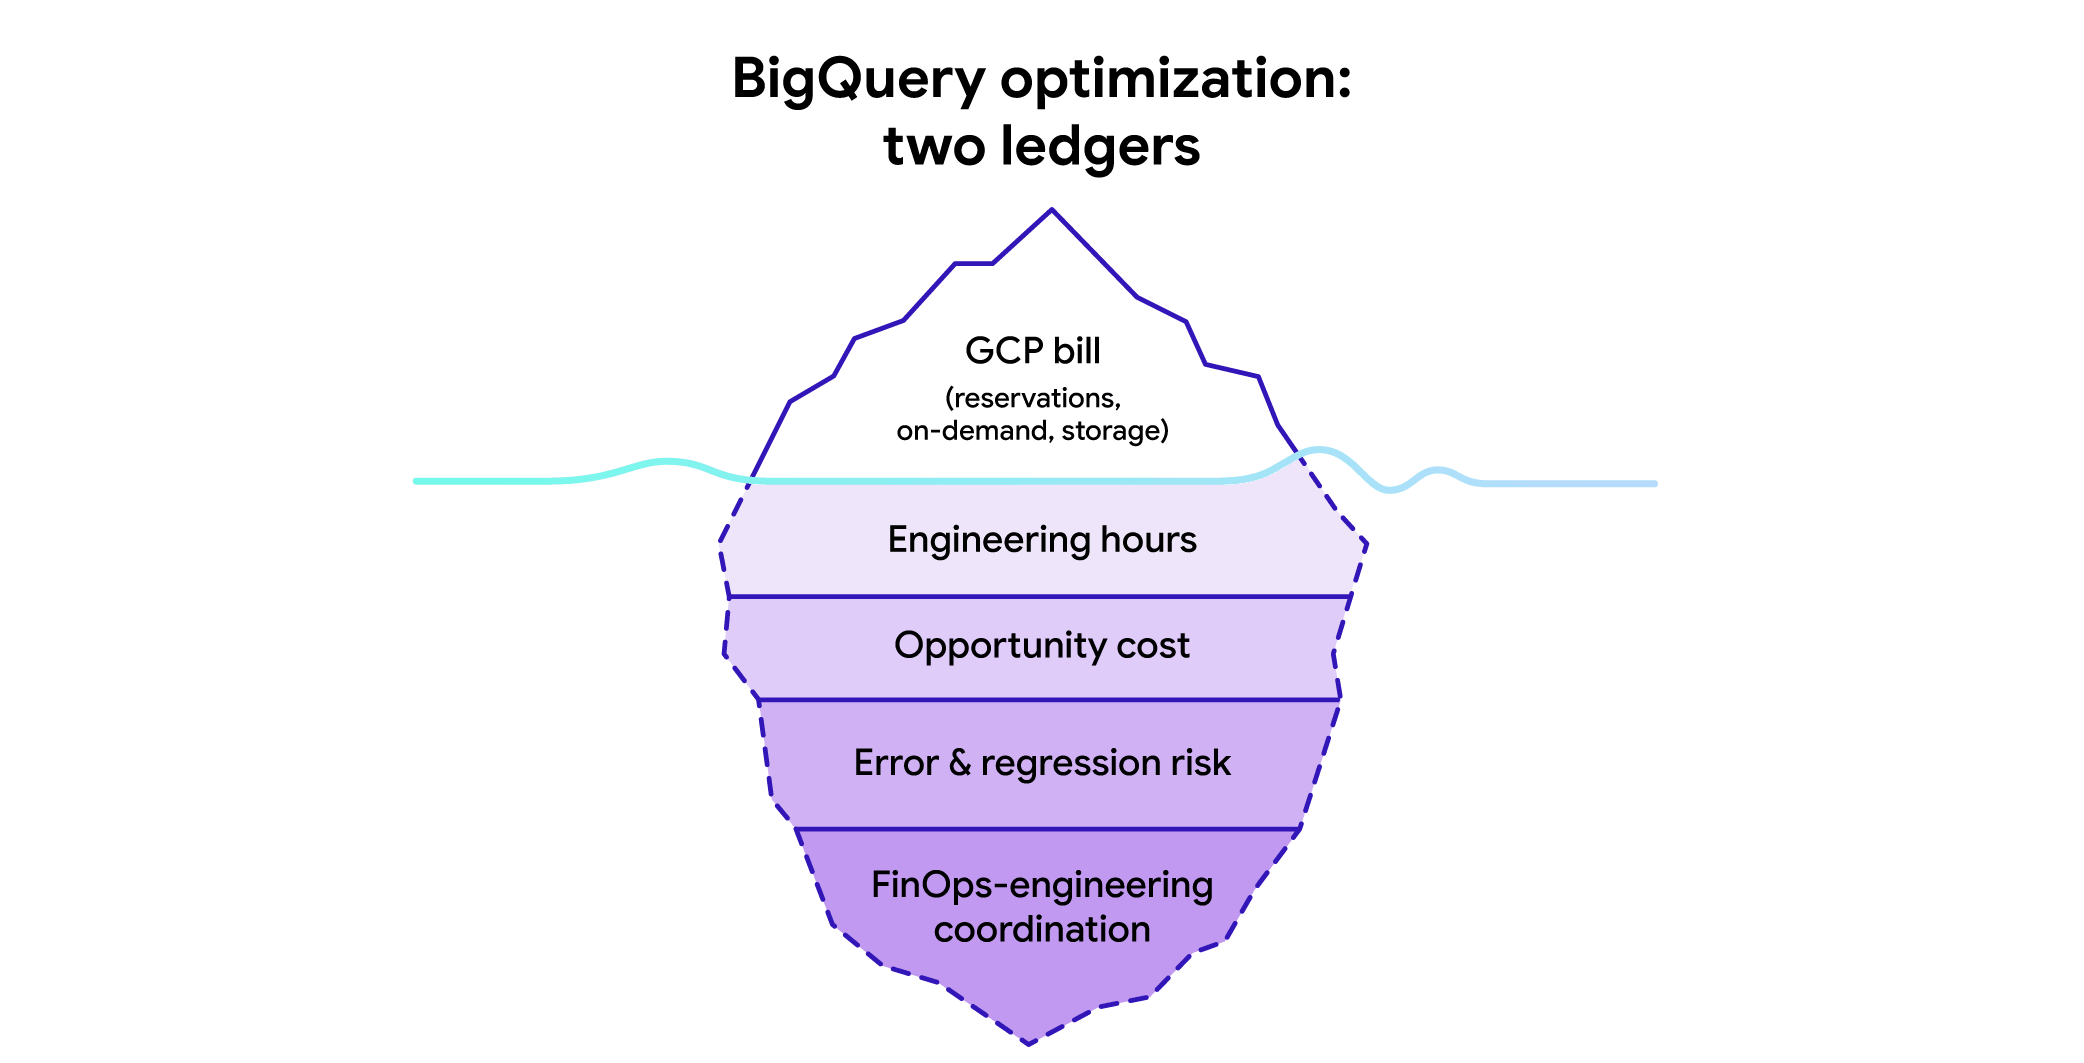
The bill vs. the actual cost
Your cloud invoice shows BigQuery spend: reservations, on-demand compute, storage, streaming. That number is real and auditable. It is also incomplete.
Manual BigQuery cost optimization adds labor that rarely appears in FinOps dashboards: engineers querying billing exports, FinOps facilitators scheduling reservation reviews, platform teams maintaining attribution rules, and squad leads investigating spikes that arrived weeks late. Opportunity cost shows up as features not shipped, migrations deferred, and senior engineers pulled into recurring cost fire drills.
Treat BigQuery optimization as two ledgers. The GCP ledger is what you pay Google. The operations ledger is what you pay your team to interpret, act on, and maintain those costs. FinOps maturity improves when both are visible to leadership.
What teams build instead of a platform
Before evaluating automation, it helps to name what most organizations already run. Few teams do nothing. Most assemble one or more of the following patterns and call it a program.
Manual optimization with GCP native tools
Google Cloud provides a solid foundation for GCP cost management: Cloud Billing reports and exports, budgets and alerts, the Recommender, Committed Use Discounts for compute, and BigQuery-specific signals such as reservation insights and slot recommender output. Billing exports to BigQuery or Cloud Storage let you analyze spend with SQL.
These tools answer important questions: where did spend go, which project crossed a threshold, whether a VM is underused. For BigQuery, they surface reservation sizing hints and exportable usage data.
What they do not do by themselves is execute continuous, workload-aware optimization. Recommendations still land in someone’s queue. Reservation changes still need engineering approval. Query-level routing between on-demand and capacity pricing still requires manual judgment per workload. Native tooling is necessary infrastructure; treating it as a finished optimization program is where hidden cost accumulates.
Learn more:
Google Cloud Cost Optimization: Native Tools & Best Practices
Homegrown dashboards and internal tooling
The next layer many teams add is custom: Looker or Looker Studio dashboards on billing exports, internal wikis with runbooks, scheduled queries that flag top spenders, Slack bots wired to budget alerts, and ad-hoc SQL against billing export tables maintained by a platform squad.
Homegrown tooling can fit your org chart and naming conventions precisely. It also creates ongoing ownership. Dashboards break when labels change. Queries need updates when Google adds new billing columns. New hires need onboarding to interpret the charts. The airline in our recent case study described engineering hours drained by manual billing analysis and custom dashboards against billing exports, work that was slow, repetitive, and still left gaps around job-level pricing decisions before releases shipped.
Quarterly reviews and FinOps cadence
Even strong visibility programs often consolidate action into a rhythm: monthly showback, quarterly deep dives, annual commitment planning. That cadence matches finance calendars. It does not match how fast data platforms change. Pipelines ship daily. Seasonality shifts slot demand weekly. A reservation tuned in Q1 can be wrong by Q2.
Manual programs work best as a first pass: find obvious waste, right-size an egregious reservation, fix the worst query. They struggle as an operating system for a platform that never stops moving.
What is the true cost of manual BigQuery optimization?
Manual optimization carries four cost categories FinOps teams should track alongside GCP spend:
Direct engineering time. Hours spent exporting billing data, building and fixing dashboards, triaging queries, reviewing reservation settings, and documenting decisions. This time has a fully loaded cost even when it is spread across several roles.
Opportunity cost. Every hour spent on cost archaeology is an hour not spent on product analytics, pipeline reliability, or migration work. For lean data teams, cost firefighting is not a side task. It displaces roadmap commitments leadership already approved.
Error and regression risk. Manual changes are point-in-time. A reservation max lowered during a spike investigation gets raised again next quarter. A query rewrite saves scan volume until the next dbt refactor reintroduces a full-table pattern. BigQuery cost is an interconnected system: tuning one lever in isolation can move waste elsewhere, a pattern we describe in detail in our post on dashboard limitations.
Learn more:
Why GCP Cost Dashboards Fail and How to Move to Automated Optimization
Coordination overhead. FinOps often owns budgets and commitments; engineering owns workload behavior. When every reservation change requires a ticket, a meeting, and a change window, observation and action are separated by days. Spend accrues in the gap.
If two senior engineers spend a combined eight to twelve hours per week on billing exports, reservation reviews, and query triage, that is roughly one full person-day per week devoted to cost work, not product work. Scale that across platform maintainers, FinOps analysts, and squad leads pulled into spikes, and the operations ledger often rivals a meaningful slice of the GCP line item, even when no single role is titled “cost optimizer.”
The engineering time tax
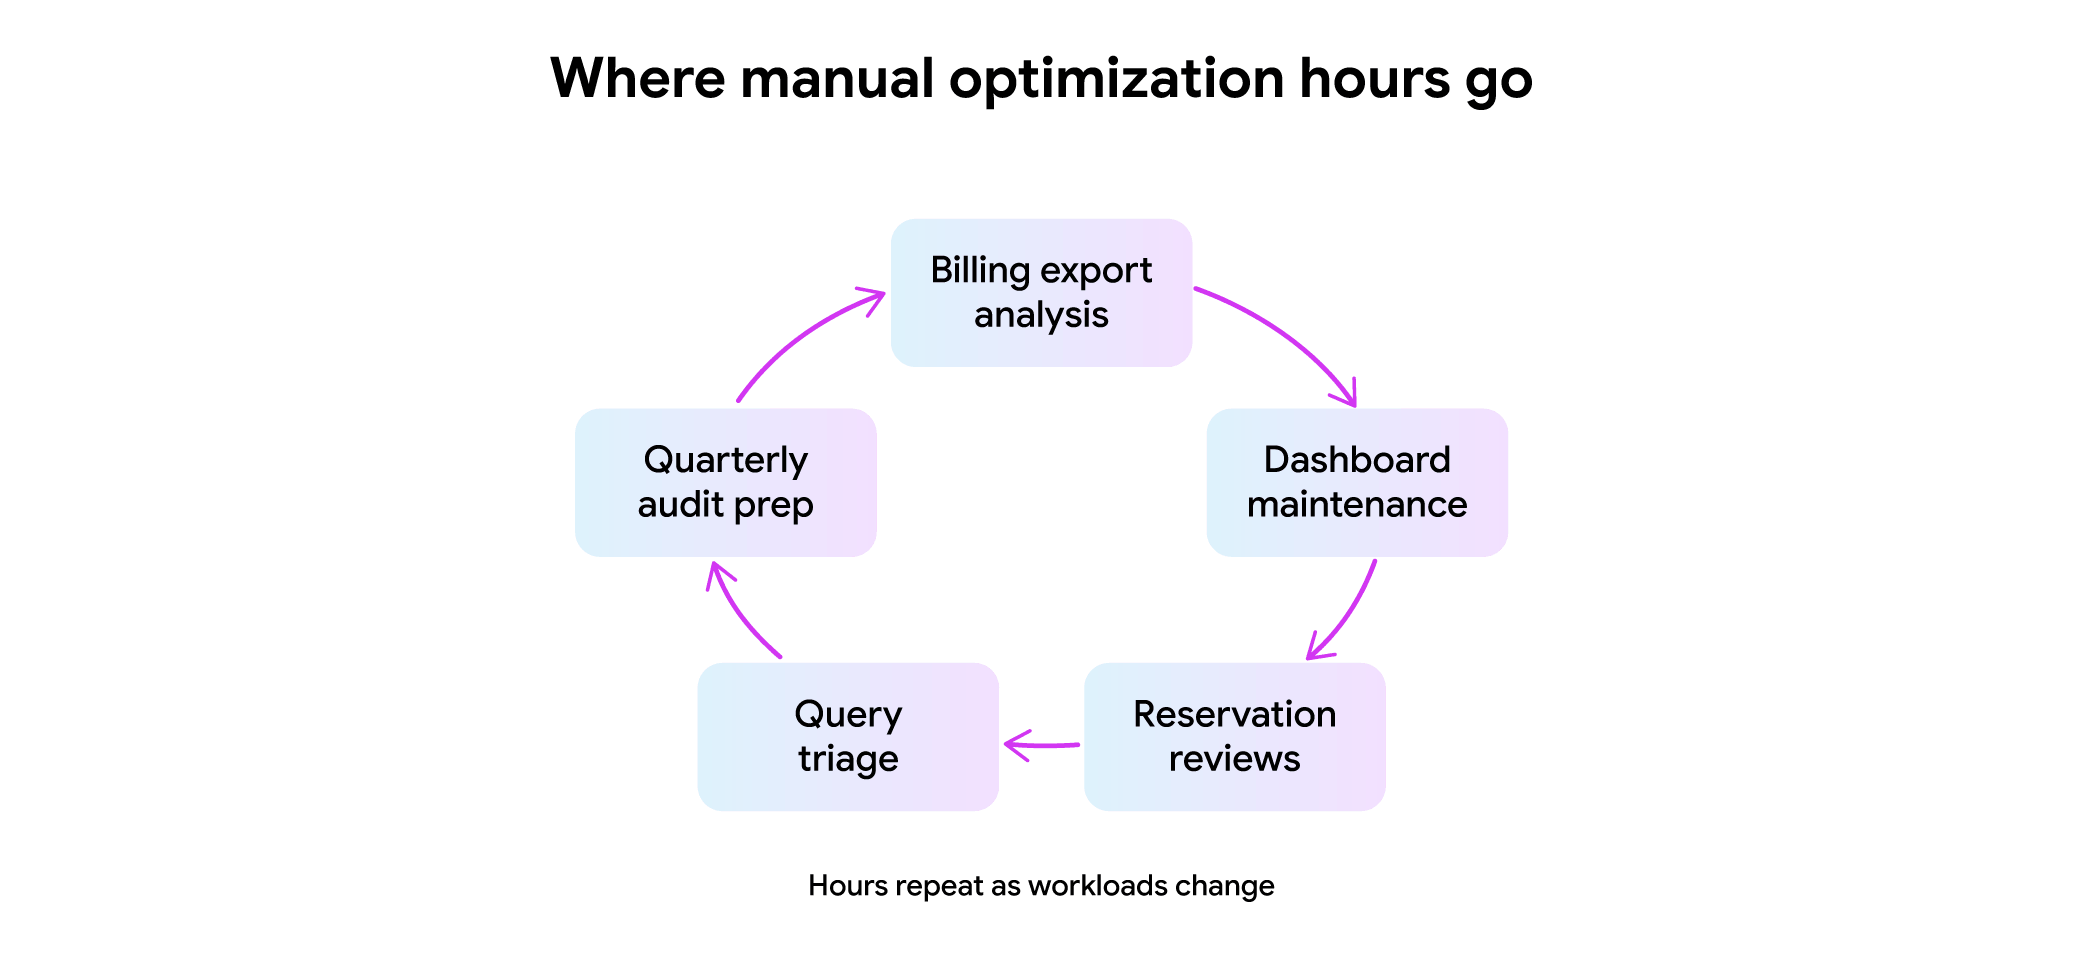
Where do the hours go in practice?
Billing export analysis. Exporting, joining, and interpreting Cloud Billing data to answer “why did this project jump?”. Investigations that should take an hour stretch into multi-day threads when attribution is incomplete.
Dashboard and pipeline maintenance. Custom cost dashboards depend on stable labels, project structure, and billing schema. Organizational changes create silent breakage until someone notices missing data in a monthly review.
Reservation and commitment reviews. Baseline slots, max autoscale ceilings, edition choice, and commitment length require recurring attention as workloads shift. Each review cycle repeats the same analysis because manual changes do not self-correct.
Query and pipeline triage. Identifying expensive jobs, chasing owners, validating fixes, and confirming savings in the next billing cycle. After the first wave of wins, returns diminish.
Rabbit’s case study with Nordstrom describes how this retail giant’s team saw the same pattern after migrating to BigQuery. Manual SQL tuning consumed significant engineering time with diminishing returns, while slot waste kept rising. Pete Bruno, FinOps Lead & Platform TPM, noted that manual approaches were delivering less impact over time even as effort increased. The team eventually reclaimed roughly 400 engineering hours per month once continuous optimization replaced much of the manual loop, alongside a 47% reduction in BigQuery spend from slot optimization.
See the full story:
Post-migration BigQuery at Nordstrom: From rising slot waste to 47% lower spend
Opportunity cost and delayed features
FinOps initiatives often fail quietly because cost work competes with delivery and loses. A reservation review waits behind a production incident. A pipeline cost fix sits in the backlog while a product launch ships. Nobody tracks those deferrals on the cloud bill.
For CFOs, the question is not only “what did we pay Google?” but “what did we not build while engineers investigated last month’s spike?” Cost optimization without automation tends to consume senior capacity, the same people whose judgment is hardest to replace.
The same pattern showed up in our blog post on pre-release BigQuery cost control: engineers at a low-cost airline were pulled into cost firefighting instead of working on features that improved passenger experience. Pre-release cost checks were absent, so teams discovered expensive behavior in production billing, weeks after the release shipped. The fix was not more dashboards. It was embedding cost visibility into the workflow so optimization happened before spend locked in.
Learn more:
Case Study: From Surprise BigQuery Bills to Pre-release Cost Control
Human error and regression risk
Manual optimization introduces human patterns that erode savings over time:
One-off fixes without guardrails. A query is tuned under pressure. Six months later, a refactor undoes the change. Nobody notices until the next quarterly review.
Over-correction on reservations. A spike prompts raising max slots; nobody schedules the follow-up to lower them when demand normalizes. Autoscale headroom set for peak becomes permanent Autoscaler Tax.
Siloed tuning. FinOps lowers baseline slots while a data team moves heavy jobs to on-demand to hit a deadline, undermining commitment economics. Without a system view, each team optimizes locally.
BigQuery cost drivers interact: pricing model per job, reservation shape, autoscale ceilings, storage billing model, SQL patterns, and organizational growth. Manual playbooks rarely document those dependencies. When staff turnover hits, the “person who knew why we set max slots to 500” leaves, and settings drift.
Why does manual BigQuery cost optimization not scale?
Three structural limits show up once BigQuery is a material line item and teams grow past a single platform squad:
Native tools inform – they do not continuously act. Dashboards, budget alerts, and billing reports improve GCP cost visibility. They do not rewrite queries, adjust max slots as utilization shifts, or route jobs to the cheaper pricing mode in real time. Acting on native recommendations still requires engineering capacity you may not have at the moment the recommendation appears.
Learn about automated GCP optimization with Rabbit:
Introducing Rabbit Agentic: Proactive GCP cost optimization in PRs and agents
Homegrown dashboards show the past, not the next release. Dashboards excel at showback and anomaly review after spend happens. They struggle to prevent waste from shipping in tomorrow’s merge. When pipeline count scales into hundreds of projects, dashboard maintenance itself becomes a part-time platform product.
Quarterly cadence cannot match daily change. Audits find problems weeks or months late. By the time a FinOps review assigns owners, the expensive job has run thousands of times. Reactive loops look like this: dashboard shows pain, manual investigation, one-off fix, drift back. Optimization stays ex-post; waste ships first.
When does automated BigQuery optimization pay for itself?
There is no universal break-even formula. Workload mix, team size, billing model, and how much manual work you already perform all change the answer. A practical FinOps framework asks three questions instead of forcing a spreadsheet template:
1. What is the fully loaded cost of your manual program?
Include direct hours (exports, dashboards, triage, reviews), maintenance of homegrown tooling, and FinOps meeting time. Compare that annualized labor estimate to platform cost and to documented savings ranges from peer organizations. Published customer outcomes show 20–52% BigQuery spend reductions depending on starting waste (Nordstrom 47%, Lufthansa Group 52%, Karrot 41%).
2. Do the same antipatterns recur?
Missing partition filters, wrong pricing mode for stable jobs, autoscale max set for peak not typical load, storage billed on the wrong model. Recurrence is a signal that point-in-time manual fixes are not sticking.
3. Can you measure before/after and roll back safely?
Automation earns trust when savings are attributable (job cost, slot waste trend, reservation utilization) and reversible when they are not. Teams that treat optimization as controlled experiments adopt automation faster than teams asked to “trust the black box.”
| Manual program | Continuous optimization |
|---|---|
| Labor: recurring hours across roles | Labor: platform + review time |
| Timing: after spend accrues | Timing: ongoing measurement |
| Coverage: point-in-time fixes | Coverage: interconnected levers |
| Risk: settings drift | Risk: measured rollback |
Learn more:
Webinar recap: How to Automate BigQuery Cost & Performance at Scale
Where continuous optimization fits
Manual programs with native tools and homegrown dashboards are a reasonable starting point. They are an expensive long-term operating model when BigQuery spend is large, workloads change frequently, and the same engineers are asked to both ship product and police cost.
Rabbit is built for teams that have outgrown that loop. It connects through read-only Google Cloud APIs (metadata only, no access to your data) and treats BigQuery cost as one interconnected system: reservation shape, autoscale behavior, job-level pricing, SQL patterns, storage billing, and more. Recommendations come first; automation is opt-in where it makes sense (for example, Max Slot Optimizer on reservations, Job Optimizer via dbt or Airflow, and Rabbit Agentic for cost review on pull requests).
Rabbit does not replace FinOps ownership: it reduces the labor and lag between seeing waste and addressing it across levers that manual programs struggle to keep aligned.
If manual optimization is consuming senior engineering time with diminishing returns, start by sizing the hidden cost: map your native-tool workflow, homegrown dashboards, and review cadence against the hours they consume. The BigQuery Savings Calculator estimates recoverable spend across reservations, autoscale behavior, and related levers. For a walkthrough of your environment, book a demo or explore case studies from teams that moved from quarterly firefighting to continuous optimization.