GKE Cost Allocation: Understanding Your Kubernetes Expenses on Google Cloud Platform
Ármin Scipiades
9 min read
Kubernetes cost allocation remains one of the most frustrating challenges for engineering teams using Google Cloud. Just when you think you’ve got your Kubernetes infrastructure running smoothly, the cloud bill arrives with eye-watering figures and no transparency about where those costs are coming from. In this post, we dissect the problems with GKE cost visibility and show you practical approaches to gain control over your Kubernetes spending.
So you have a Google Kubernetes Engine (GKE) cluster up and running. Maybe three—one for dev, staging and prod—because we’re not cavemen. And your clusters are running fine now, powering your app and microservices and the various auxiliary workloads, and also the gazillions of seemingly random Pods the data team is spewing forth in their infinite wisdom.
Then the Google Cloud Platform (GCP) bill arrives, and it’s quite high. In fact, it’s been creeping up every month, and there’s a vague sense across the company that, yes, costs should be brought down.
In an ideal world, your GCP bill would be transparent, easy to understand, and capable of telling you at a glance just what’s driving your cost. But this isn’t an ideal world, and understanding your GKE costs beyond the most basic use cases is frustratingly difficult. I maintain that the reason FinOps exists in the first place is that cloud provider billing is needlessly complex and opaque.
I could rant about cloud billing all day, but let’s focus on your GKE bill now.
How do you make sense of it?
You see, when optimizing costs or identifying cost drivers, you’re not really interested in your total GKE expenses or how much your clusters and node pools cost. You need a more granular breakdown. You want to know how much you spend on an application, a specific feature, functionality, or initiative.
How are you going to do that?
Struggling with the GKE Billing Report
You check the billing reports screen first. You marvel at just how unwieldy it is. You will realize much of your Kubernetes spending is billed, actually, as Compute Engine costs.
That’s not exactly wrong: you are paying for the nodes, after all, the machines running your workloads. But even if it’s technically not wrong, it’s still a problem, and you will sink into black despair, staring at your Kubernetes nodes lumped together with your regular Compute instances…
…until you realize you can find the Compute Engine resources used in your GKE clusters by filtering on the goog-k8s-cluster-name label (which is, thankfully, automatically applied).
This way, you can get the cost of your actual GKE clusters.
Which is nice, but how do you get the cost of the workloads?
GKE Cost Allocation to the Rescue
The GKE Cost Allocation is one of those GCP features that Google finally announces after years of people begging for it, and it’s sort of okay (functional, if limited), so we fall to our knees and give thanks to the powers that be, even though the functionality really should have been there since day one.
But I digress.
So, you go to the details page of your cluster and enable the “Cost Allocation” config. From then on, your detailed billing export will get more lines, a lot more lines.
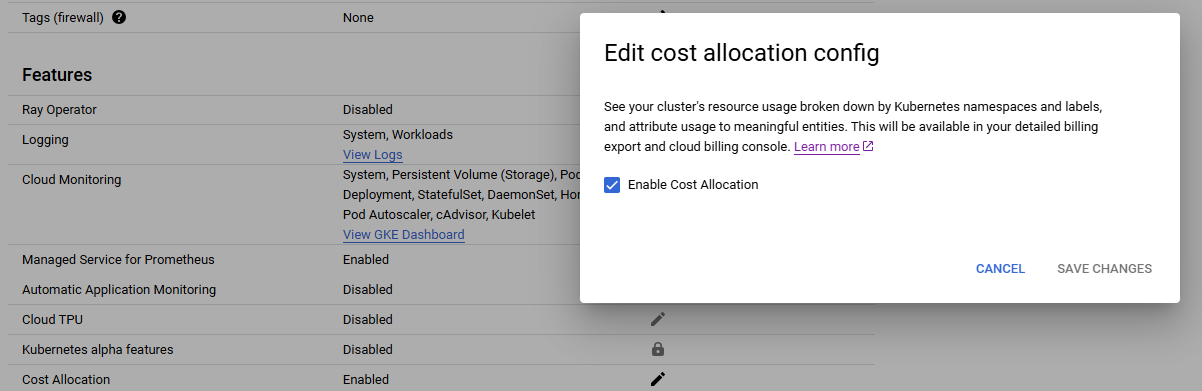
This adds a whole lot of labels to your Compute billing rows, notably k8s-workload-name which finally lets you see workload-level costs! Stupendous!
Even better, it adds Kubernetes labels on the billing entries! This feature lets you break down the total cost of your workloads by any dimension (teams, projects, cost objectives, anything), simply by adding a Kubernetes label in the descriptor of your workload, improving your Kubernetes cost attribution.
One common use case is tagging costs by teams, letting you see quickly just which team is responsible for your runaway costs. This isn’t about blaming, it’s about accountability. DevOps taught us that “whoever built it should maintain it”, and that thinking should absolutely apply to FinOps as well.
I realize you’ll face organizational inertia on this, but I say unto thee, make your teams think about the costs they incur, and make them aware of the cost implications of the things they do.
Anyhow.
At this point, you should stop clicking around the billing reports screen and start using the detailed billing export table in BigQuery. Sure, writing huge queries comes with its own brand of misery, but at least you are able to list all your workloads, like this:
SELECT
  sku.description AS sku,
  label.value AS workload_name,
  SUM(cost) AS cost
FROM
  [YOUR-DETAILED-BILLING-EXPORT],
  UNNEST(labels) label
WHERE
  label.key = 'k8s-workload-name'
  AND project.id = 'rbt-dev-app-eu'
  AND usage_start_time BETWEEN '2025-01-05' AND '2025-02-01'
GROUP BY
  sku,
  label.value
ORDER BY
  cost DESC
Having written your gigantic queries, you can now stuff them in Looker dashboards or Sheets or something. It’s all clunky, but at least it’s repeatable, and you can share the data with your team without having to give them access to the billing reports, and so on.
Amazing.
Where GCP Billing Falls Short for GKE Cost Attribution
There are technical limitations, like “if your workload has more than 50 Kubernetes labels, none of them will be converted into a billing label”. That’s jarring, but fine. We can live with it.
But I’m going to talk about more significant limitations here.
Reinventing the Wheel with a DIY FinOps Tool
So, you’ve built your Looker Studio dashboard. You can finally see what each workload costs, maybe even comparing this month’s spending to last month’s. It’s really cool.
The problem is, you’re not the only one doing this. Instead of giving you a comprehensive, extensible FinOps solution, GCP gives you a pile of tools to build your own. It’s a really nice pile of tools, one could argue it’s the best setup of all the cloud providers, but nonetheless, it leads to a proliferation of homebrew systems, and also commercial systems that are barely more than a glorified set of BigQuery queries.
Whenever you are struggling with writing a query about your GKE clusters, you can be sure hundreds, if not thousands, of the exact same query exist somewhere in the world. This is insane: not just from an engineering best practice standpoint, but also because your company is then paying you to tinker with dashboards instead of creating value for your customers, while a solution already exists.
The solution? A proper cloud cost transparency platform. Preferably one that’s more than a glorified Looker Studio report. I’m thinking Rabbit, obviously.
What’s “The Cost of a Workload” Exactly?
I’ve been talking trash about FinOps tools that are nothing more than a pretty UI slapped on top of billing export queries, and here’s why.
GKE Cost Allocation data is based on resource requests, not actual usage.
“Resource request” defines the amount of CPU/memory GKE sets aside for the Pod to use, but the Pod may use less or more than that. The GKE Cost Allocation, however, is based purely on what’s requested.
This can easily lead to situations where a workload appears to be cheap, while in reality,it regularly uses twice as much as it requested. Or an expensive workload may turn out to be using only a fraction of what it requests, the excess reservation wasted—and you’ll have no way of knowing this from the billing reports.
That’s a bit of a bummer, isn’t it?
This is where Rabbit comes in: by pulling data from the GCP Monitoring API, we track the actual allocated CPU & memory instead of just the requested values. Not only is this a more realistic cost attribution model, but it also lets you detect wasted capacity.
Unattributed costs: the case of pods without a workload
Remember the gazillions of seemingly random pods the data team keeps launching?
There’s this pattern, especially in data engineering, that an application is creating short-lived Pods to do some work. These standalone Pods don’t have a Controller, Kubernetes doesn’t know they’re related to each other, that’s only known by the application that creates them.
Spark is one such application, as isArgo Workflows and many others.
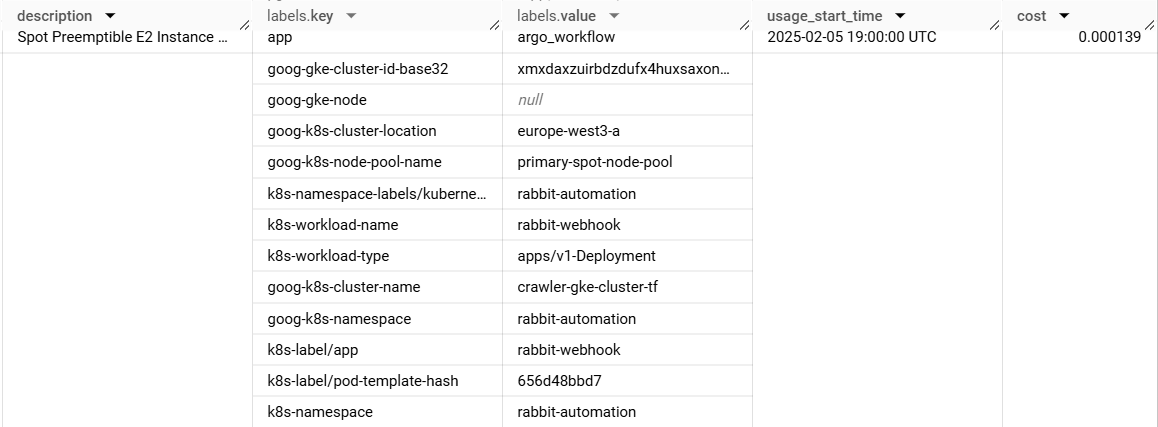
GKE Cost Allocation isn’t handling these very well. Here’s the billing entry for an Argo workflow job from our own cluster:
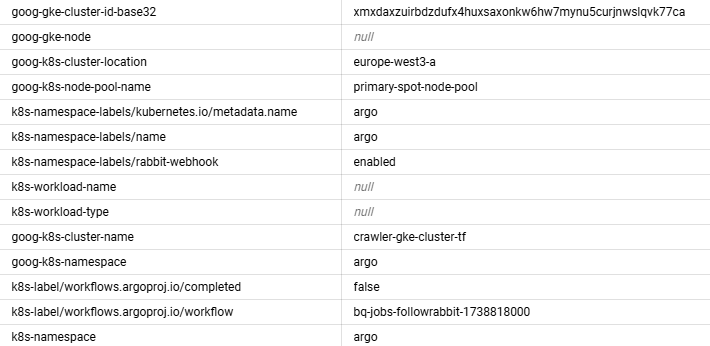
You can see the workload name is… just missing. Your dashboard and most FinOps tools won’t be able to handle these.
Unattributed costs II: the case of the missing pods
It gets worse!
Some Pods have such a short lifespan that they aren’t even registered as Kubernetes expenses! They don’t get the goog-k8s-cluster-name label. GCP billing shows no sign these are GKE costs.
Yep, you read that right. We have a customer where 40% of their GKE expenses aren’t tagged as GKE expenses in any way.
This is because Google apparently attributes costs based on their Kubernetes metrics. But Kubernetes metrics are only sampled every 60 seconds. So, if a Pod runs for less than 60 seconds, it can completely fall through the cracks. If a Pod is running for, say, 30 seconds, there’s a good chance its data is lost.
This problem affects everything built on top of GCP billing and monitoring.
Currently, Rabbit is affected as well, but we have a Clever Plan to solve it. Watch this space!
Conclusion
Understanding GKE costs shouldn’t be difficult, but here we are.
Even with GKE Cost Allocation enabled, GCP billing report is misleading, some costs going entirely unattributed. If your GKE usage doesn’t conform to the terribly basic structure GCP seems to expect, then you’re on your own. Good luck making sense of your numbers.
The fix is a proper cloud cost transparency platform that tracks real usage, handles attribution correctly, and gives teams the visibility they need. If it can give you recommendations to optimize your costs, all the better.
That’s what Rabbit strives to become. And it’s what Google should have built in the first place.
Sign up for a free trial, or contact us to try Rabbit on demo data.
'/%3e%3cpath%20fill-rule='evenodd'%20clip-rule='evenodd'%20d='M45.5%2025.5518L34.1769%2038.2287L32.7627%2036.8145L45.5%2025.5518Z'%20fill='white'%20stroke='white'%20stroke-width='0.5'%20stroke-linejoin='round'/%3e%3cpath%20d='M70.5152%2014.3181C73.7912%2020.0199%2075.5103%2026.4829%2075.5%2033.0589C75.4896%2039.6349%2073.7502%2046.0925%2070.4563%2051.784C67.1624%2057.4755%2062.4297%2062.2008%2056.733%2065.4858C51.0363%2068.7708%2044.576%2070.5%2038%2070.5'%20stroke='%23369AF8'/%3e%3cpath%20d='M0.500329%2032.8429C0.527791%2026.287%202.27351%2019.8528%205.56339%2014.182C8.85327%208.51124%2013.5723%203.80204%2019.25%200.524045'%20stroke='%23369AF8'/%3e%3cdefs%3e%3clinearGradient%20id='paint0_linear_13001_7939'%20x1='22.5'%20y1='48.5356'%20x2='49.5016'%20y2='48.5356'%20gradientUnits='userSpaceOnUse'%3e%3cstop%20stop-color='%239B51E0'%20stop-opacity='0.8'/%3e%3cstop%20offset='1'%20stop-color='%23369AF8'/%3e%3c/linearGradient%3e%3c/defs%3e%3c/svg%3e)